| Parameters | Datatype | Description | Default Value |
|---|---|---|---|
loadingText | String | Specify the loading text while fetch data from databse. | Loading... |
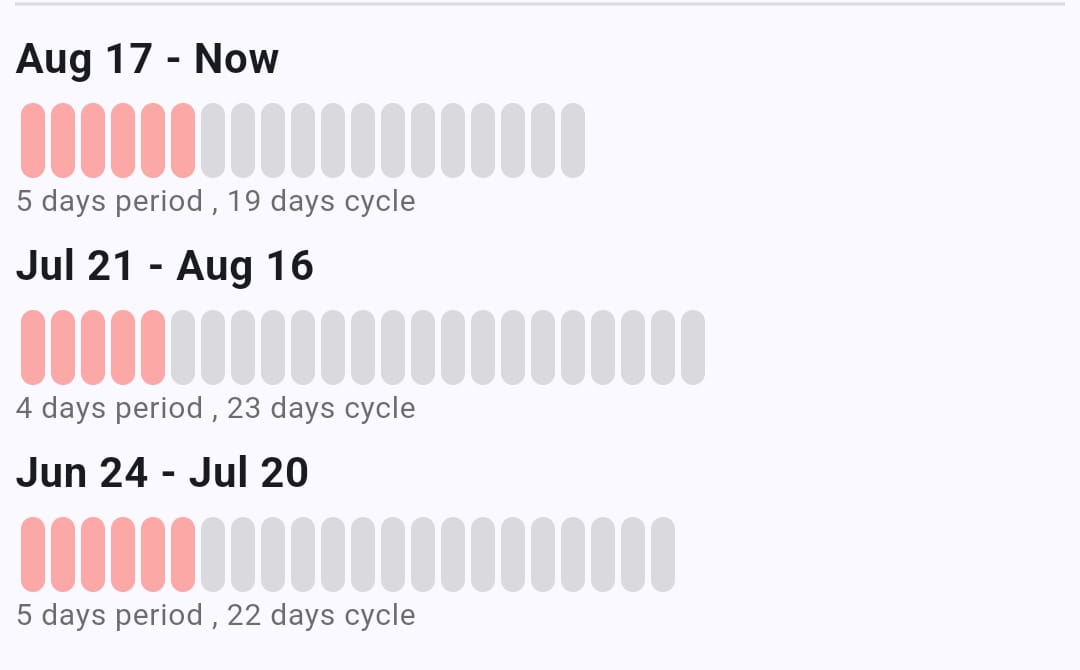
headerTitle | String | Specify the header title | Cycle History |
headerTitleTextStyle | TextStyle | Specify the text style of yAxis | TextStyle(color: Colors.black, fontSize: 10) |
viewCycleHistoryLength | int | Speficy the length of cycle history which you want to show | 3 |
appBarBackgroundColor | Color | Specify the title bar color of AppBar | Colors.blueAccent |